Overview
A release campaign for MYRY runs on Meta ads: pre-save ads before release day, then "listen on Spotify" ads after it. The money goes out through Meta Ads Manager. The results show up in Spotify for Artists. Distributor earnings arrive months later in a DistroKid CSV, and publishing royalties turn up in PRS statements.
Four tools, four timelines, and four slightly different ideas of what a country is. The question every campaign raises is simple: did this spend move streams for this song in this market? None of them could answer it. Spotify for Artists has no export at the level that matters (song, country, day and where the stream came from), and it only shows recent windows.
Metify answers it on my own computer. A Chrome extension collects what Spotify for Artists already loads in my signed-in session, and a local app stores everything in SQLite and puts it all on one graph. Nothing leaves the machine.
- One graph. Meta, Spotify, DistroKid and PRS on a shared timeline, filtered by song, market and source.
- Honest numbers. Data that was never measured shows as missing, never as a zero.
- Private. It runs on localhost, with the database on an external SSD.
My role
Everything product-side: what to build, how it should work and look, the data model, and testing it on my own campaigns. The code was written by AI coding agents under my direction, one phase at a time.
Process
1. Scraping the screen
The first version (May 2026, with the catchy name "Meta × Spotify Buddy Collector") was a Chrome extension that clicked its way through Spotify for Artists: every Audience, Music and Playlist page, every time filter, every subtab and a full list of countries, storing it all in chrome.storage. The first run was a full "bootstrap" crawl, and later runs only picked up what had changed. The data was all there, but scraping the visible interface was slow and broke easily.
2. A dashboard that outgrew its home
By July the dashboard lived inside the extension: one 690 KB file on top of browser storage, with crawling, import, export, settings and analysis sharing a single toolbar. Browser storage was never going to hold millions of rows, so I added a small local SQLite bridge, and then decided the data needed a proper home.
- v0.9.51 to 0.9.52: compact and single-song progress views, so I could see how much of each song had been crawled.
- v0.9.54: a raw data explorer, to inspect exactly what had been captured.
- v0.9.55: a small Python server the extension could push rows into, my first step out of the browser.

3. The split: the extension collects, the app thinks
In late July I cut the extension down to a crawler and a sign-in bridge, and moved the analysis into a Node and Express app on localhost, with SQLite as the warehouse. The extension keeps its own queue if the app is offline, checks in every 30 seconds, and every row is keyed on track, country, date, metric and source, so fetching the same day twice never counts it twice.
The data path ended up as five steps:
- Capture. The extension reads the page and API responses Spotify for Artists already loads in my own session, and replays those requests to fill gaps.
- Queue. A background worker normalises the rows and holds them in a persistent queue until the app is ready.
- Ingest. The local API upserts each row on track, country, date, metric and source.
- Store. SQLite on an external SSD keeps the raw evidence archived, with compact facts and daily rollups for fast reads.
- Compare. The dashboard puts Meta, Spotify, DistroKid and PRS on one graph.
The same version brought the shared comparison graph, saved layouts, a coverage planner, DistroKid CSV import and Meta Ads ingestion. The first git snapshot, on 31 July, was 55 files and about 36,000 lines.

4. One graph, many questions
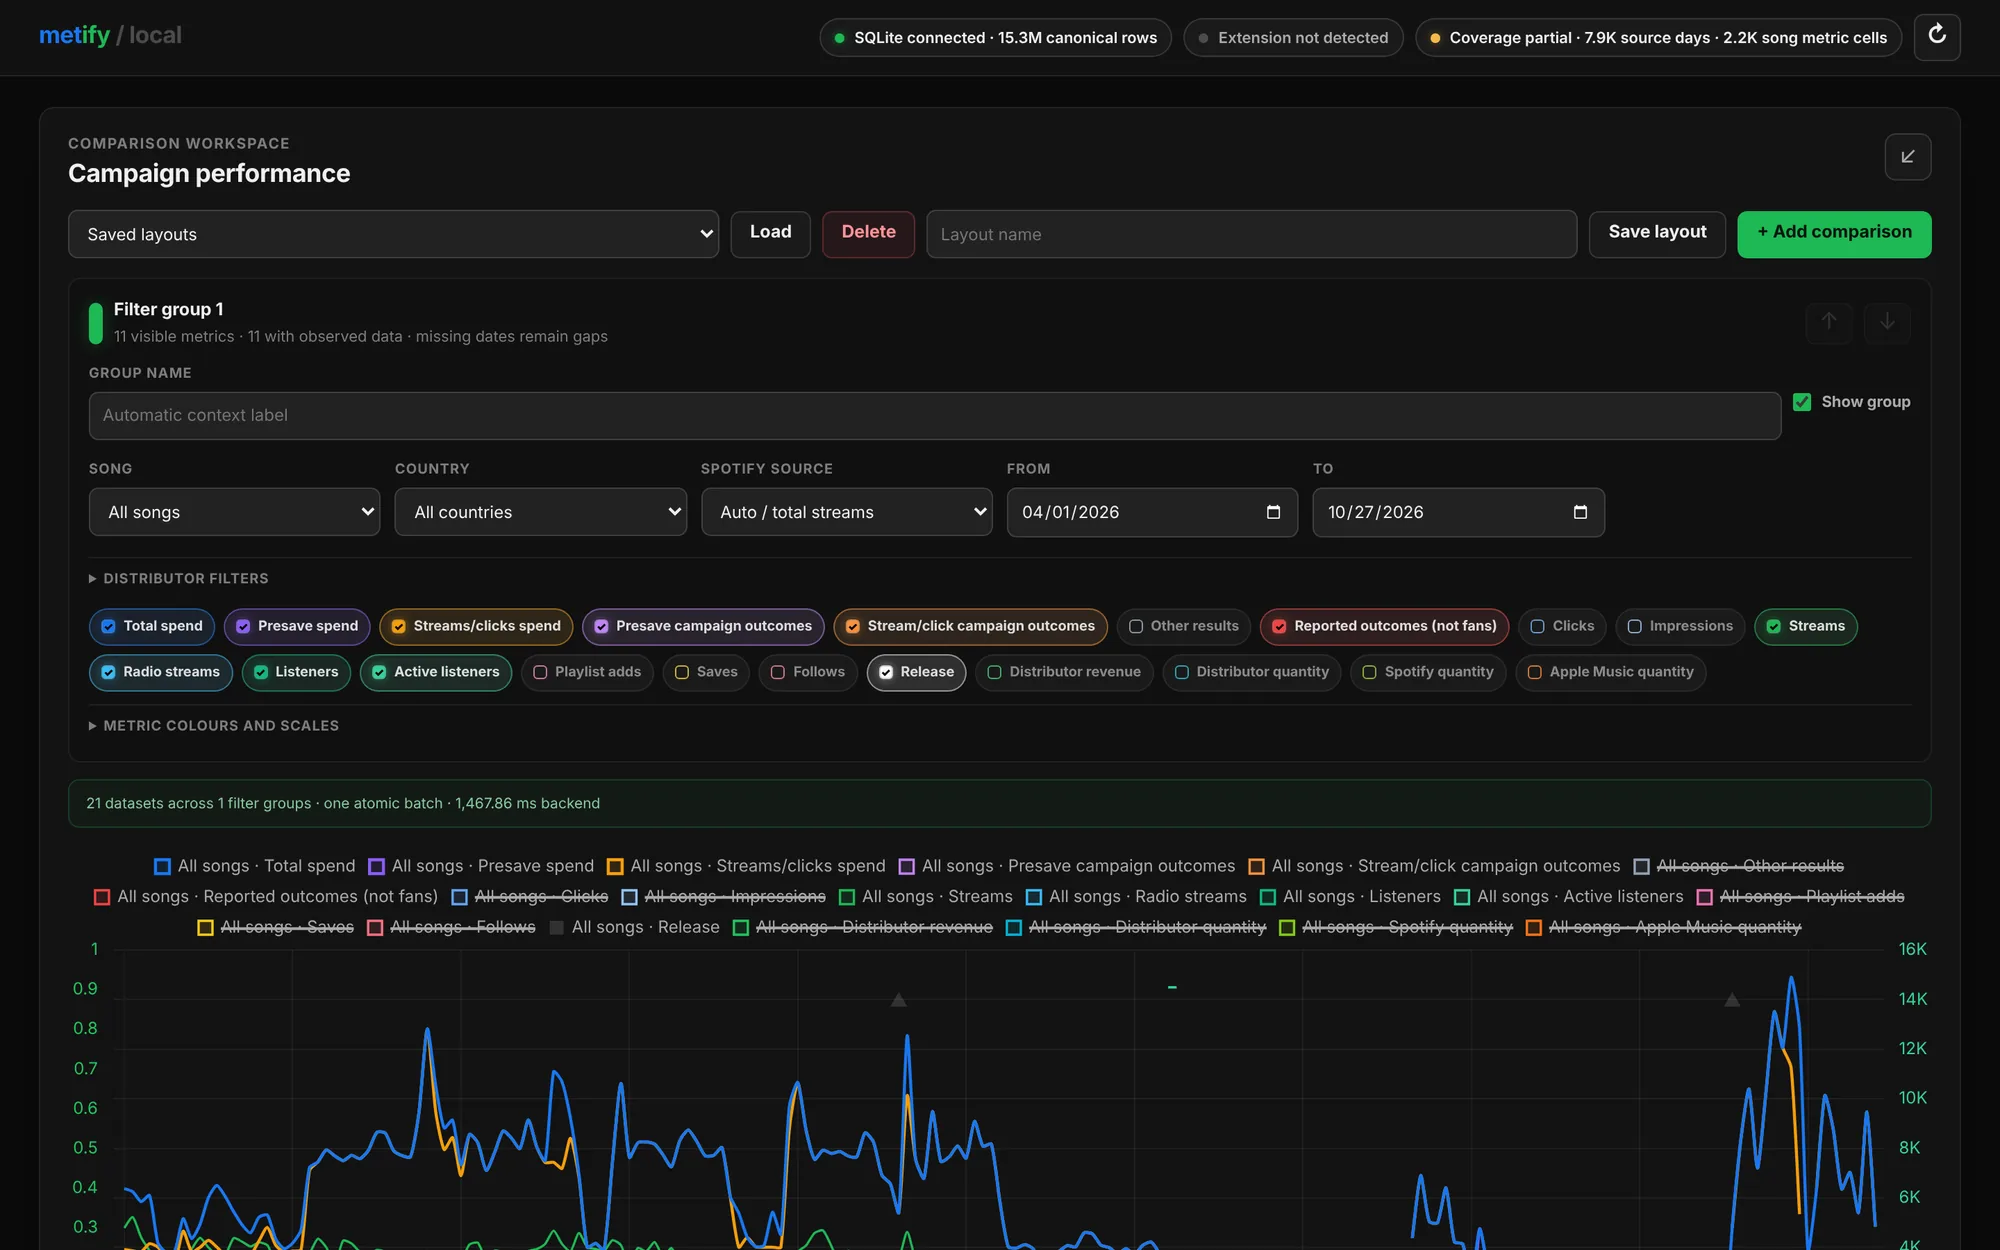
Early versions had a chart per data source, which meant flicking between them and comparing in my head. The redesign made a single shared graph the centre of the product. Each filter group picks a song, a country, a Spotify source and a date range, and adds up to twenty metrics from Meta, Spotify and the distributor. Groups stack, reorder and save as named layouts, so a comparison like "Maze ad activity against Maze streams worldwide" takes two clicks to rebuild.
Colour always means the same family of data: blue is Meta spend, green is Spotify listening, and warm tones are campaign outcomes. The metric chips use the same colour as their line, so the legend doubles as the filter.


5. Missing isn't zero
In August the database got too big to query quickly, so I planned a migration with a way back at every step. Rewriting the live database in place felt too risky, so it ran in phases that didn't touch what the dashboard was reading:
- Raw evidence archived as gzipped JSON Lines files, each with a checksum.
- Spotify and Meta facts rebuilt in a new compact, sparse model alongside the old one.
- Every read the dashboard makes run against both, and checked for matching answers.
- A shadow period where new data went into both databases.
- The switch-over itself: one atomic pointer swap, with the previous database kept as an instant rollback.
The most important decision in that model was storing "explicitly zero" and "never observed" as two different things, and it ended up shaping the whole interface. A card can say "Partial", "No data" or "Worldwide only", and the graph leaves out days whose totals are incomplete, so it never draws a dip that didn't happen. In October I went back through the profit numbers with the same rule: blank labels and dashes had been read as zeros, and some Meta results were being counted twice.
The header follows the same idea. Before any chart loads, it tells you whether the database is connected, when the extension was last seen and whether coverage is partial or complete.
6. Finding the real bottleneck
By September the crawl felt slow and patchy, and I assumed Spotify was the problem. A proper diagnosis said otherwise: fixed pauses, one-at-a-time writes and a coverage table that had stopped updating after the migration. Stale coverage made data look missing, which queued more crawling, which slowed the computer down. The fix was to call the data directly, skip the page navigation, batch the rollups, and make coverage something I could trust. That's what made the roughly nine times speed-up below possible, while still sending Spotify only one request at a time.

7. Four streams of money, one vocabulary
Spotify, Meta, DistroKid and PRS each get their own tab, with the same filters and the same states. Connecting Meta only checks access, and fetching history is always a separate, explicit date range with a cancel button, so nothing slow or expensive happens by surprise. Raw rows are one click away from every report and every table exports to CSV, so when a number looks odd I can see where it came from.


PRS for Music was the last to arrive, in October, as a fourth income stream. The most recent changes came from daily use: song titles missing from Spotify rows are now looked up and cached so every chart label is readable, and the rules for when a fetch counts as fresh got stricter.
Impact
In October I filled in the full history for 28 recordings across worldwide and 12 markets, then checked every source-day from 1 April to 16 October month by month.
| Collection | Before | After |
|---|---|---|
| Comparable 28-day jobs per minute | 1.90 | 17.25 |
| Newly verified source cells per minute | 480 | 4,347 |
| Failed jobs in the comparable run | 0 | 0 |
| Requests to Spotify at once | 1 | 1 |
Metify now has 38 automated test scripts, each running on a throwaway database, and a 1.7 GB database that still feels instant because the app only loads what you're looking at: the shell, headline numbers and chart come first, and coverage, raw rows and reports load when you open them. In total it's roughly 15,000 lines of server code, 3,000 lines of dashboard and 26,000 lines in the extension.
What I learned: a number that looks right and isn't is worse than no number at all. The working rules that got me there were simple: back up before any migration, never delete raw data, test on a temporary database, and never call anything complete until it's been checked. Every phase started with a written brief and ended with a write-up, which is also why I can tell this story with dates.